If necessary paperwork is NOT provided & ANY changes are required, there WILL be a $200 fee:
Required Order Form
Think of your EDM-930 as your personal flight engineer. Always there, working in the background, constantly watching over your engine while you concentrate on flying the aircraft. Your EDM-930 will be monitoring your engine conditions four times per second and will warn you instantly if any measurement exceeds the programmed limit.
Leaning is accomplished quickly and automatically using the LeanFind™ procedure. With the EDM it is now possible to have substantially more diagnostic information available to you in a timely and usable manner.
The EDM 930 collects data and displays it for you in a useful way. You can use the EDM 930 to monitor engine temperatures and voltages, adjust the fuel/air mixture, and diagnose engine malfunctions.
Analog Display
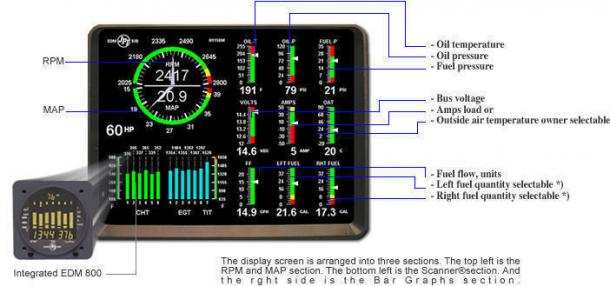
The display screen is arranged into three sections. The top left is the RPM and MAP section. The bottom left is the Scanner® section. And the right side is the Bar Graphs section.
RPM and MAP Section Display
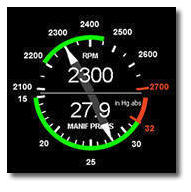 The upper semicircular bar graph shows the RPM (Revolutions per Minute) and the lower semicircular bar graph shows the MAP (Manifold Pressure). These are shown both graphically and digitally. Power settings entering red line are displayed by flashing the ALERT icon and flashing message on the bottom left scanner section of the screen. Percent horsepower is displayed digitally underneath the MAP arc The upper semicircular bar graph shows the RPM (Revolutions per Minute) and the lower semicircular bar graph shows the MAP (Manifold Pressure). These are shown both graphically and digitally. Power settings entering red line are displayed by flashing the ALERT icon and flashing message on the bottom left scanner section of the screen. Percent horsepower is displayed digitally underneath the MAP arc
Bar Graphs Section Display
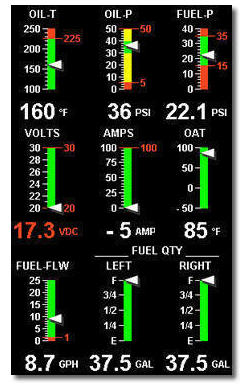 The Bar Graphs section contains nine dedicated 12 segment bar graphs with digital display. The default displays are (left to right, top to bottom): The Bar Graphs section contains nine dedicated 12 segment bar graphs with digital display. The default displays are (left to right, top to bottom):
- Oil temperature
- Oil pressure
- Fuel pressure
- Bus voltage
- Amps load or charge/discharge
- Outside air temperature (or owner selectable )
- Fuel flow, units per hour
- Left fuel quantity (or owner selectable)
- Right fuel quantity (or owner selectable)
The top of the bar is redline and the bottom of the bar is zero for O-T, OP, F-P, amps load. For amps charge/discharge the center of the bar is zero and the top and bottom is redline charge and discharge, respectively. For volts the top of the bar is high redline and the bottom of the bar is low redline.
The top of the bar for Fuel Flow is set by the MAX FF parameter. The white horizontal line indicates freezing for OAT. The ranges and alarm values are user settable and are described later in section Section 10 - First Time Setup and Customization on page 36.
Basic Scanner Operations
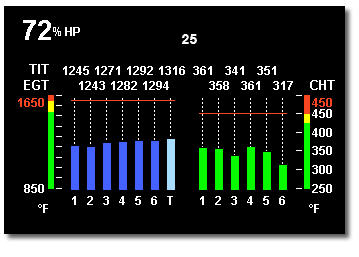 Let’s examine the scanner section analog display. Central to the display is the exhaust gas temperature— or EGT— bar graph presentation. The height of each column represents the EGT. The last column shows turbine inlet temperature. The range of the EGT columns is red line at the top down to one half of red line at the bottom. This is called the percentage view because you are looking at a percentage of red line. The Normalize view allows you to see small, subtle changes in temperature. When you change to the Normalize view—hold the Lean Find button for three seconds all column heights are set to the identical half-height. Any changes are shown as an increase or decrease in column height. A one-bar change in column height represents a 10 degrees change. Let’s examine the scanner section analog display. Central to the display is the exhaust gas temperature— or EGT— bar graph presentation. The height of each column represents the EGT. The last column shows turbine inlet temperature. The range of the EGT columns is red line at the top down to one half of red line at the bottom. This is called the percentage view because you are looking at a percentage of red line. The Normalize view allows you to see small, subtle changes in temperature. When you change to the Normalize view—hold the Lean Find button for three seconds all column heights are set to the identical half-height. Any changes are shown as an increase or decrease in column height. A one-bar change in column height represents a 10 degrees change.
The Normalize view permits rapid visualization of EGT trends, rather than a percentage of red line. The missing segment in the column represents the cylinder head temperature. Above each column is a number corresponding to the engine cylinder number. The rightmost column displays turbine inlet temperature. Beneath the bar graph is the alphanumeric display. A single index dot above one column indicates which cylinder is being displayed on this numerical display. When the index dot is beneath a cylinder number, 1 through 6, the digital display shows the EGT on the left four digits and the CHT on the right three digits. Two other derived measurements are shown in this display:
The rate of shock cooling of the most rapidly cooling cylinder, in degrees per minute. Lycoming recommends that you keep this value below 50 degrees per minute.
The difference between the hottest and coolest exhaust gas temperatures.
EGT
EGT is shown on the first four or six Scanner bar graph columns. These are labeled 1 through 4 or 1 through 6 above the columns. The lower limit of the graph range represents half of the TIT alarm red line (default is 825°F) and the top of the range represents alarm red line (default 1650°F). The numerical value of the EGT is shown on the left side of the digital display for each cylinder when there is a dot under one of the cylinder numbers above the column—cylinder 2 in this example. There are two views: Normalize view levels the EGT columns and increases the sensitivity of the Scanner bar graph columns to 10° per segment. To enter the Normalize view, hold the LeanFind button for three seconds. The NRM icon will be displayed above the Scanner section. Hold the LeanFind button for three seconds to return to the Percentage view.
CHT
The Cylinder Head Temperature—CHT—is represented by a missing segment in the Scanner bar graph column. If the EGT is too low for there to be a missing segment, the CHT is represented by a lone segment in that column. The scale is shown to the left side of the columns. The numerical value of the CHT is shown on the right side of the digital display for each cylinder when there is a dot under one of the cylinder numbers above the column.
TIT
If you have TIT, it will be shown on the right-most Scanner bar graph column and will be labeled with a T above it.
Normalize View Indicator Percentage view (when the NRM icon is not lighted): the columns indicate percent of EGT red line. Each column is composed of a stack of segments. A maximum height column depicts 100 % of red line and a one segment-high column depicts 50 % of red line. For example, if the red line is 1650°F, a maximum height column represents 1650°F and a one segment high column represents half that value, or 825°F. The Percentage view permits comparison of EGTs across all cylinders. Hotter cylinders display higher columns than cooler cylinders.Normalize view (when the NRM icon is lighted): the EGT columns are displayed normalized. When you change to the Normalize view, all columns are initially set to the same half height level for trend analysis. Any changes are shown as an increase or decrease in column height. A one-segment change in column height represents a 10°F change. The Normalize view permits rapid visualization of EGT trends, rather than a percentage of red line. You can use normalize in level cruise and run-up. The Normalize view allows you to see small, subtle changes in temperature. When you change to the Normalize view — hold the right button for three seconds — all column heights are set to the identical half-height. Any changes are shown as an increase or decrease in column height. A one-bar change in column height represents a 10 degrees change. The Normalize view permits rapid visualization of EGT trends, rather than a percentage of red line. Above each column is a number corresponding to the engine cylinder number. The rightmost column, if present, displays oil temperature. If turbine inlet temperature is installed, then the rightmost column will indicate this with a T above that column. Beneath the bar graph is the alphanumeric display. A single index dot above one column indicates which cylinder is being displayed on this numerical display. When the index dot is beneath a cylinder number, 1 through 6, the digital display shows the EGT on the left four digits and the CHT on the right three digits.
To toggle between Percentage and the Normalize views, hold the LF button for three seconds until the NRM icon toggles. The analog display becomes half height and the display changes to the Normalize view. Selecting the Normalize view does not affect the digital display nor alter the measurement sequence. The scale of the CHT display—described later—is not affected by the Normalize or Percentage view. You may select the Normalize view in either the Manual or Automatic mode. Normalize view is most helpful for engine trend monitoring of each cylinder’s operation during cruise. When using the Normalize view during engine run-up, a fouled spark plug will appear as a higher column. A common misapplication is to be in the Normalize view and then change your power setting, causing all columns to go off scale, high or low. Select the Percentage view before adding or reducing power. Always select Percentage View when beginning your descent.
Buttons?
 There are four buttons on the front panel. From left to right they are the STEP button, the Lean Find button, the GMT button, and the EGT fuel flow button. Ten minutes after the EDM-900 is turned on, it will automatically index through all measurements. There are four buttons on the front panel. From left to right they are the STEP button, the Lean Find button, the GMT button, and the EGT fuel flow button. Ten minutes after the EDM-900 is turned on, it will automatically index through all measurements.
Tapping the STEP button will always take you into the manual indexing mode. Here you can observe each measurement value for as long as you want. To the resume the automatic indexing, tap Lean Find and then tap STEP. To switch between the percentage view and the Normalize view, hold the Lean Find button down for five seconds. The GMT button displays the time in the lower left scanner section. It also shows to which measurement each of the nine bar graphs is configured. You have a choice of three display indexing options as selected by the EGT-FF button. · The EGT position will display only temperature-related measurements· The FF position will display only the fuel flow-related measurements, and· The ALL position will display all measurements.
The display indexing option does not affect the bar graph display, nor does it effect the alarms. Any alarm, such as an over temperature alarm will immediately display the alarm message regardless of which display indexing option is selected.
What about Lean Find Mode ?
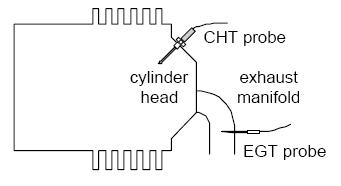 In a piston engine only a small portion of the energy from combustion produces movement of the piston during the power stroke. The majority of energy passes into the exhaust pipe as hot gasses. By monitoring the temperature of these exhaust gasses you will have an indication of the quality of the combustion process. Low compression, non-uniform fuel distribution, faulty ignition, and clogged injectors diminish the efficiency of the combustion process that generates power. From the cockpit you can adjust the fuel/air ratio by a process called leaning. Retarding the mixture control changes the fuel/air ratio and hence the resulting Exhaust Gas Temperature (EGT). In a piston engine only a small portion of the energy from combustion produces movement of the piston during the power stroke. The majority of energy passes into the exhaust pipe as hot gasses. By monitoring the temperature of these exhaust gasses you will have an indication of the quality of the combustion process. Low compression, non-uniform fuel distribution, faulty ignition, and clogged injectors diminish the efficiency of the combustion process that generates power. From the cockpit you can adjust the fuel/air ratio by a process called leaning. Retarding the mixture control changes the fuel/air ratio and hence the resulting Exhaust Gas Temperature (EGT).
The following figure depicts the mixture and temperature relationship.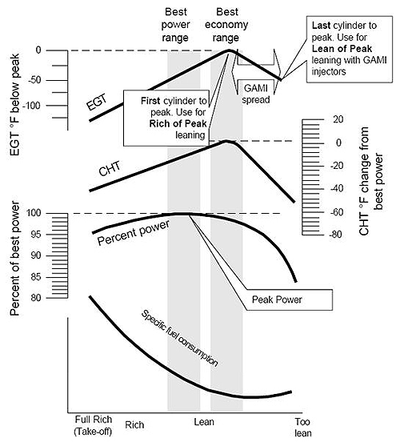
|
So how do I use the Lean Find Mode?
Upon reaching cruise configuration, you can use the LeanFind mode to identify the first cylinder to reach peak EGT. Note that this is the leanest cylinder, not necessarily the hottest cylinder.
You begin the leaning process by pre-leaning the mixture to about 50 degrees below the estimated peak on any one of the cylinders. For example, let’s say that you have determined that 1350 is the pre-lean value for your aircraft. Now wait about 30 seconds for temperatures to stabilize.
You can enter the LeanFind mode by simply tapping the LeanFind button. You will then see the exhaust gas temperature of the hottest cylinder on the left display. Now you slowly lean the mixture at a rate of about 5 degrees per second. When there is a 15° rise in EGT, the Lean Find will become active, indicated by the flashing cylinder number of the hottest cylinder. If you have the fuel flow option, the fuel flow rate will be shown on the right display. Stop leaning when the column begins flashing. You will see PEAK EGT on the display, followed by the value of the exhaust gas temperature of the first cylinder to peak.. In most cases you will now be on the lean side of peak by about 10 degrees. While the column is flashing, slowly enrich the mixture. The temperature will increase, returning to peak. Stop enriching at the desired exhaust gas temperature, usually peak to 20 degrees rich of peak for best economy.
|

 The upper semicircular bar graph shows the RPM (Revolutions per Minute) and the lower semicircular bar graph shows the MAP (Manifold Pressure). These are shown both graphically and digitally. Power settings entering red line are displayed by flashing the ALERT icon and flashing message on the bottom left scanner section of the screen. Percent horsepower is displayed digitally underneath the MAP arc
 The Bar Graphs section contains nine dedicated 12 segment bar graphs with digital display. The default displays are (left to right, top to bottom):
  Let’s examine the scanner section analog display. Central to the display is the exhaust gas temperature— or EGT— bar graph presentation. The height of each column represents the EGT. The last column shows turbine inlet temperature. The range of the EGT columns is red line at the top down to one half of red line at the bottom. This is called the percentage view because you are looking at a percentage of red line. The Normalize view allows you to see small, subtle changes in temperature. When you change to the Normalize view—hold the Lean Find button for three seconds all column heights are set to the identical half-height. Any changes are shown as an increase or decrease in column height. A one-bar change in column height represents a 10 degrees change.
  There are four buttons on the front panel. From left to right they are the STEP button, the Lean Find button, the GMT button, and the EGT fuel flow button. Ten minutes after the EDM-900 is turned on, it will automatically index through all measurements.
 In a piston engine only a small portion of the energy from combustion produces movement of the piston during the power stroke. The majority of energy passes into the exhaust pipe as hot gasses. By monitoring the temperature of these exhaust gasses you will have an indication of the quality of the combustion process. Low compression, non-uniform fuel distribution, faulty ignition, and clogged injectors diminish the efficiency of the combustion process that generates power. From the cockpit you can adjust the fuel/air ratio by a process called leaning. Retarding the mixture control changes the fuel/air ratio and hence the resulting Exhaust Gas Temperature (EGT).
Отзывы ещё не добавлены